The US Energy Workforce Crisis: A Verified Update for 2026
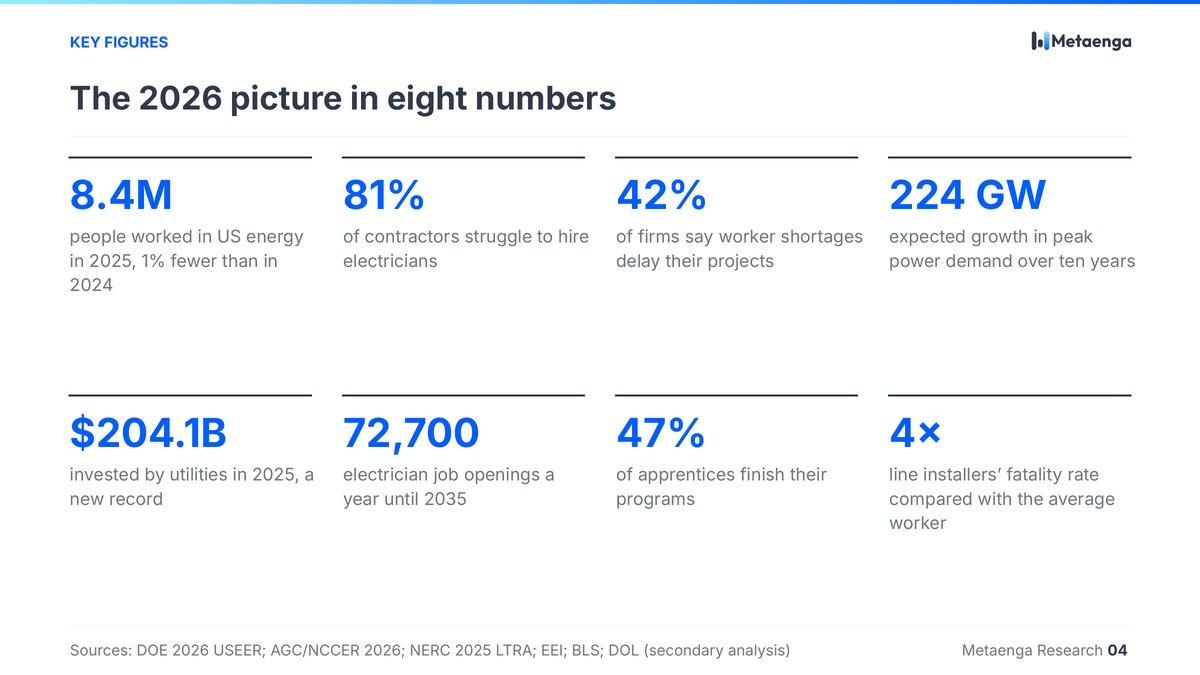
US energy employment fell 1% in 2025, yet the grid, nuclear and gas distribution kept hiring. The shortage sits in a narrow set of roles: experienced electricians, lineworkers, substation technicians and operators, all of which take years to train. This update rebuilds the picture from the latest DOE, BLS, LBNL and AGC data.
Demand is moving to the grid and electrical trades. Grid, nuclear and gas distribution grew in 2025 while clean energy lost almost 37,000 jobs. BLS now projects utilities as the fastest-growing sector of the economy to 2035.
The bigger risk is inexperience. 56% of core utility technical staff have under 10 years on the job, and total turnover reached its highest level since 2008. Building competence quickly now matters more than recruiting alone.
Labor is the top cause of construction delays. 42% of contractors report delays from worker shortages, and data-center projects are sharpening the competition for electricians.
A split market
The US energy sector employed 8.4 million people in 2025, about 5% of all US jobs. Median pay of $63,000 sits 24% above the national median. Headline employment slipped by 86,000, but that number hides two markets moving in opposite directions.
Grid, gas distribution and firm generation hired. Solar, wind and offshore wind contracted after the OBBBA tax changes and the offshore stop-work orders. Clean energy lost almost 37,000 jobs across 35 states, with California alone down about 21,000, and 142 manufacturing, generation and storage projects were cancelled or scaled back.
Who is hardest to hire
DOE describes an “acute shortage” in construction, installation and repair trades, and a “particularly high shortage” in electrically skilled roles, which it ties directly to data centers. Contractor surveys say the same: 87% of construction firms have open craft positions, and 88% of them find those roles as hard or harder to fill than a year ago.
Pressure is uneven. In 2024, 63% of nuclear equipment manufacturers called hiring “very difficult”, the highest of any generation subsector, and 95% of onshore oil construction and services employers reported at least some difficulty. Solar is the exception: the share of employers calling hiring “very difficult” fell from 44% in 2022 to 26%.
28% of construction firms worked on data-center projects in the past year. Among firms that rated the impact on the labor market:
DOE expects US electricity consumption to grow 2.5% in 2027, against 0.1% a year in 2005–2020, and transmission investment to rise 22% over 2025–2028. Sources: AGC/NCCER 2026, DOE USEER 2026
Openings tell the real story
BLS projects utilities as the fastest-growing sector of the US economy over 2025–2035, at +9.8% or 58,800 jobs, and names AI-driven electricity demand among the reasons. Growth rates for green roles look dramatic, but the volumes are small: solar installers (+36.5%) and wind technicians (+29.5%) together add fewer than 15,000 jobs.
The scale of the crisis is set by electricians and lineworkers. Even modest growth there produces tens of thousands of openings a year, most of them replacing people who retire or change careers.
| Role | Jobs | Change | Openings / yr | Median pay |
|---|---|---|---|---|
| Electricians | 821,000 | +9% | 72,700 | $63,190 |
| Power-line installers & repairers* | 127,400 | n/a | 10,700 | $95,320 |
| Electrical & electronics installers/repairers | 117,700 | +2% | 8,900 | $74,490 |
| Power plant operators & dispatchers* | 46,600 | −10% | 3,800 | $103,600 |
| Solar PV installers | ~31,000 | +36.5% | n/a | $53,140 |
| Wind turbine technicians | 11,800 | +29.5% | 1,500 | $64,120 |
| Nuclear technicians | 6,700 | +1% | ~900 | n/a |
| Nuclear reactor operators | 5,200 | decline | ~400 | $122,890 |
Highest share per capita: Wyoming, North Dakota and West Virginia.
Only ERCOT and SPP queues grew in 2025. Immigration raids hit Southern contractors hardest and the Northeast least.
The bigger risk is inexperience
For utilities, much of the generational handover has already happened. The energy workforce is younger than the US average, so the familiar “retirement cliff” story no longer fits the data. What utilities face now is a large cohort of newer staff who have not yet built deep field experience, and some of whom leave early.
of workers in core utility technical roles have less than 10 years of experience.
Total turnover reached 7.2% in 2022, the highest since 2008, with the sharpest rise in non-nuclear generation. Source: CEWD 2023
Globally the picture differs. The IEA counts 2.4 workers nearing retirement for every energy newcomer under 25 in advanced economies. In the US utility workforce, though, the practical priority is clear: shorten the time it takes a new hire to work safely and independently, and keep them in the job.
Why traditional training can't keep up
An electrician apprenticeship lasts four to five years, with around 2,000 hours of paid practice each year. A nuclear reactor operator also needs an NRC license on top of long on-the-job training. Training on live substations, energized lines or reactor simulators depends on scarce facilities and mentors.
The most common reason new field hires leave in the first 90 days is a mismatch between what they expected and what the job really involves. Half of contractors (50%) say candidates lack the required skills, certifications or licenses, down from 57% a year earlier. Requirements are also rising on the digital side: NERC CIP standards are mandatory for grid operators and raise the bar for staff working with SCADA, substation automation and relay protection.
What the shortage costs
Worker shortages are now the leading cause of construction delays, ahead of equipment lead times. Contractors are responding with higher pay and more training spend, and the industry still needs to bring in hundreds of thousands of new workers each year.
Only 13% of capacity filed in 2000–2020 reached commercial operation. Gas in queues rose 86% to 253 GW.
Queues mostly reflect grid and permitting barriers, and LBNL does not break out a labor share. Official wage data looks modest: median lineworker pay rose 3.0% to $95,320 between May 2024 and May 2025, and electrician pay 1.3% to $63,190. DOE cautions that this data works like a three-year moving average, so it reflects labor cost increases late. Contractor surveys point to stronger pressure.
Policy: apprenticeships, nuclear and offshore wind
Federal policy is pulling in two directions. Apprenticeship and nuclear goals raise demand for skilled workers, while tax changes and stop-work orders have made wind and solar employment far less predictable.
| Plant | Federal loan | Workforce | Status |
|---|---|---|---|
| Palisades | $1.52bn | Up to 600 jobs | Fuel loading paused in August after a fuel assembly tilted; NRC approved the removal plan on 13 October |
| Crane | $1bn | 550+ staff, incl. 80 operators in NRC training; ~145 returning former TMI staff; 3,000+ contractors | Restart planned for 2027 |
| Duane Arnold | Within the $4.4bn | Not disclosed | Part of the DOE restart program |
Safety culture is a staffing issue. In October 2026 the NRC found a “chilled work environment” in some Palisades work groups, meaning staff did not always feel free to raise safety concerns. Procedural discipline is as much a bottleneck as headcount.
Where VR/XR fits
The roles under most pressure share three traits: long time to independent work, training that depends on live equipment, and a high cost of error. That is where immersive training helps most, as a layer that sits alongside hands-on practice. Published US energy evidence is still limited, so measuring results matters.
The gas business expects to save around 3 hours per course and more than $500,000 a year. These are the company's own figures, not an independent evaluation.
Utility cases including BGE and Ameren found VR learning outcomes broadly on par with traditional methods, and AR pilots showed measurable gains in task completion time.
Parity matters in practice: the same outcome without taking equipment out of service, waiting for an instructor or traveling to a yard.
Where it pays off first
Switching sequences, lockout/tagout, pole-top procedures, substation familiarization and storm restoration drills.
Verification testing, arc flash awareness, fault finding and commissioning steps for data-center and generation work.
Startup and shutdown, abnormal operating procedures, permit-to-work, valve alignment and alarm response.
Realistic job previews before day one, aimed at the expectation gap behind most 90-day turnover.
| Category | Metric |
|---|---|
| Readiness | Time to qualification and independent work, first-time pass rate |
| Quality | Procedure errors, switching errors, lockout/tagout deviations |
| Safety | Incident and near-miss rates among trainees and new hires |
| Retention | 90-day and 12-month retention, apprenticeship completion |
| Efficiency | Instructor hours per completion, travel, equipment downtime for training |
Most exposed subsectors
Training providers will add the most value where they shorten the path from new hire to independent work for lineworkers, substation technicians, electricians and operators.
Data-center demand, rising transmission investment and the highest fatality risk all meet here. Training takes years, and only about half of apprentices finish.
Electricians remain the hardest trade to hire, and data-center competition keeps pushing wages up.
Restarts and federal targets depend on licensed operators, of whom the US has only about 5,200. Palisades shows that safety culture is as tight a constraint as headcount.
The most volatile segment. Layoffs and stop-start projects put trained crews at risk of leaving the industry.
| Topic | Often quoted | Current figure |
|---|---|---|
| Lineworker fatality rate | 19 per 100k, 5x average | 13.8 per 100k, ~4x (CFOI 2024) |
| Apprenticeship completion | below 35% | ~47% (FY2019–2024) |
| Electrician openings | 81,000 a year | 72,700 a year (2025–2035) |
| Welder shortage | 360,000 by 2027 | 320,000 by 2029 (AWS) |
| “32 million energy jobs” | energy sector need | Energy and infrastructure combined, 2025–2035: 17M new + 15M replacement (Brookings) |
Frequently asked questions
Short answers to what energy, training and safety leaders ask most about the US workforce data above, with the sources named.
How many people work in the US energy sector?
The US energy sector employed 8.4 million people in 2025, about 5% of all US jobs, according to the DOE's 2026 US Energy and Employment Report. Headline employment slipped by 86,000 (−1%), but grid transmission, distribution and storage added 28,000 jobs while clean energy lost almost 37,000 (E2's analysis of DOE data).
Is there an electrician shortage in the US?
Yes. Electricians are the hardest craft to hire: 81% of construction firms seeking them struggled to fill roles in 2026 (AGC/NCCER survey of 1,830 firms). The DOE describes a "particularly high shortage" in electrically skilled roles, which it ties directly to data centers.
How many electrician jobs will open each year?
BLS projects about 72,700 electrician openings a year over 2025–2035, from 821,000 jobs in 2025 (+9%). Most openings replace people who retire or change careers rather than new growth. The median electrician wage was $63,190 in May 2025. Power-line installers and repairers add about 10,700 openings a year (2024–2034 projection).
Which trades are hardest to hire in US energy and construction?
Electricians, mechanics and HVAC technicians. In the 2026 AGC/NCCER construction survey, 81%, 79% and 77% of firms seeking them struggled to hire. In DOE's survey, 74% of energy-efficiency employers, 70% of power-generation employers and 67% of grid and storage employers reported at least some hiring difficulty in 2025.
How are data centers affecting hiring for electrical trades?
They are tightening the market: DOE ties a "particularly high shortage" in electrically skilled roles directly to data centers. Among construction firms that rated the labor-market impact, 58% see tougher competition for workers, 49% see upward pressure on wages, 36% find roles harder to fill and 30% report higher turnover (AGC/NCCER 2026). DOE expects US electricity use to grow 2.5% in 2027, against 0.1% a year in 2005–2020.
Is a retirement wave causing the US energy skills shortage?
The data point to inexperience more than retirements. Energy workers are younger than the US average: 17% are 55 or older versus 24% of all US workers (DOE, data for 2022). Among core utility technical roles, 56% of workers have under 10 years of experience, and turnover reached 7.2% in 2022, the highest since 2008 (CEWD).
How long does it take to train an electrician, and how many finish?
An electrician apprenticeship lasts four to five years, with around 2,000 hours of paid practice each year. About 47% of registered apprentices complete their programs (FY2019–FY2024, a third-party analysis of Department of Labor data), and 83% of firms report losing new field hires within 90 days.
Where does VR/XR training fit in closing the US energy workforce gap?
VR/XR is best positioned as a layer alongside hands-on practice for roles with a long time to independent work, training that depends on live equipment and a high cost of error, such as lineworkers, substation technicians, electricians and plant operators. Published US energy evidence is still limited: Duke Energy's results are self-reported, and EPRI cases found outcomes broadly on par with traditional methods.
- USEER (employer survey) and BLS data (OEWS, QCEW, projections) use different methods and are not directly comparable.
- Updated 2025–2035 BLS profiles for lineworkers and power plant operators were not available, so verified 2024–2034 figures are used.
- The 2024 lineworker fatality rate comes from a BLS chart as reported by a secondary source (ReliaMag).
- The apprenticeship completion rate is a third-party analysis of the DOL portal, which is labeled beta.
- Clean energy job losses are E2's analysis of DOE data; E2 is a business advocacy group.
- Duke Energy's VR results are self-reported; no independent evaluation was found.
Sources: DOE USEER 2026, BLS, BLS OOH (electricians), LBNL, AGC/NCCER, ABC, CEWD, DOL, NRC, EPRI, E2
Powering the Gap
America's hands-on energy workforce, 2026–2035
- Demand: power forecasts, utility investment and data centers
- Supply: job openings, people leaving and the training pipeline
- Workforce risk: age, time to train, safety and hiring
- Outlook: scenarios, a risk ranking and five actions for leaders
Building an energy workforce?
Metaenga builds VR simulations for technical training, from electrical verification testing to high-voltage switching. We help utilities, training centers and energy companies give new hires safe, repeatable practice of critical procedures before live work, without live risk or equipment downtime.